Toastuary is over, the cheese is settling and we are quite enjoying having normal meals again. After an entire month of eating toasties, and an entire night of feeding other people toasties, it’s data time. I am delighted to report that the toastie statistics have never been so exhaustive.
Toastuary Toastie Statistics
A different toastie every day (except the 21st), each posted to the website where I have google analytics feeding me data. Traffic more than doubled over the month. This was partly due to our army of keen toastie enthusiasts who read every single blog post, but also because after writing about toasties for a month, google was fairly sure that’s what we were selling.
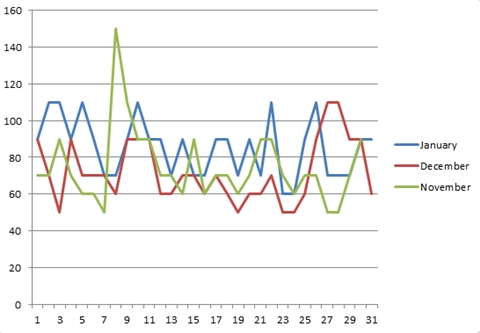
Impressions are the number of times your site pops up in search results. These are for searches containing the word “toastie”. It doesn’t look like much, but December and November are both identical. January is a tick higher.
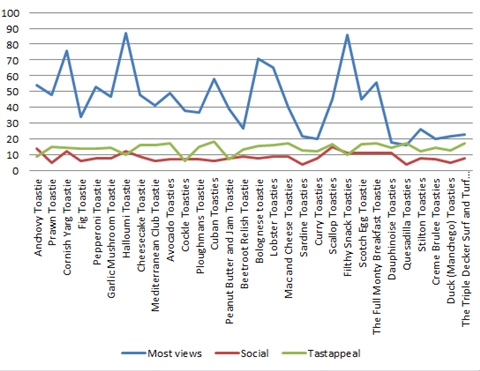
The page views are steady until the final week. Each post was tweeted out once, and 90% of the hits would come during that first day. There could be some forgiving the final week of toasties based on this potential 10%, but it’s more likely to have been toastie fatigue. What is strange is that the tasteappeal (where I add the taste and appeal scores out of 10 together to make a more visual statistic) bears almost no resemblance to the amount of hits on the website. The halloumi toastie and the filthy snack actually appear to benefit from it.
So, given that our two top scorers are also two of the most prized failures of the month, why the hell have people clicked on them?
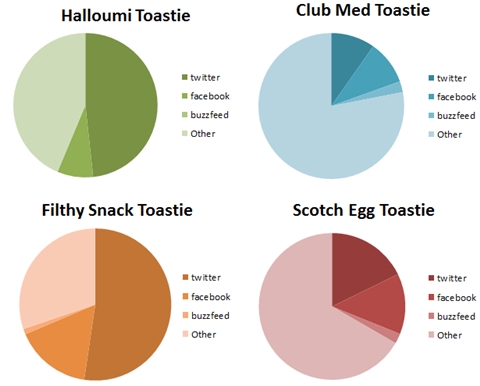
Yeah, it’s twitter. On the left you have the two big hitters of the month, on the right you have two toasties with average hits. The two offending tweets were:
Today we tried Halloumi; the results were not good http://t.co/sPC5HoPdE1 #BadTimes #Toastuary
— The Jabberwocky (@jabberwockyfood) January 7, 2015
This should never have happened. I think we went too far. Too late. http://t.co/bs7Z9vQ7HD
— The Jabberwocky (@jabberwockyfood) January 23, 2015
Both quite negative and, as one commenter on Facebook kindly points out, clickbaity. No significant drop in social shares though, so clearly everyone loves a good catastrophe.
Tasting Toastie Statistics
The toastie tasting (or toasting) was held on the final day of Toastuary. It was to celebrate a return to normal meals, to road test the one toastie neither of us really liked (Marmite), the final toastie of the month (The Surf and Turf) and the top toasties from the past 31 days.
- The Marmite Toastie. We had several versions with jalapeños, crispy onions, gherkins and plain. All with cheese. Of course.
- North Atlantic prawns with thousand island dressing, watercress, Spanish chorizo and mozzarella (2nd Jan)
- Scotch Egg – Cheddar, sausage patty, hard boiled egg and English mustard (24th Jan)
- The quesadilla: Mexicana cheese, fried peppers and onions, chorizo and chicken (27th Jan)
- Surf and Turf (2 varieties) Scampi, mac and cheese, gherkins, braised beef, cheese | Beef, king prawns, sautéed mushrooms, cheese, dauphinoise (31st Jan)
- Strawberry cheesecake toastie. After eating on this scale you need something sweet. (8th Jan)
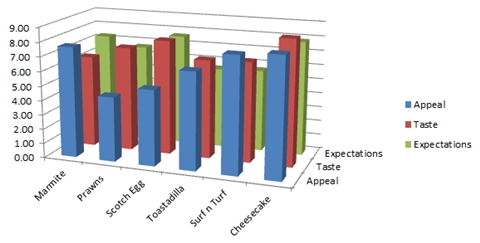
Big winner here is the cheesecake toastie. The big surprise was that prawns are apparently less appealing than Marmite (WHY?). Just for extra data goodness, here are the ratings next to our original values:
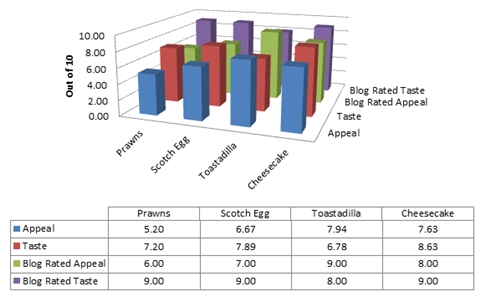
The values from the tasting are lower in every case, which makes sense because these were personal favourites of ours. I am quite pleased that I got the Toastadilla round the right way: more appealing than it actually tastes. FACT.
The Scotch Egg toastie is also a dark horse, with comparatively low appeal but confoundedly good taste. It wound up top savoury of the night.
Then there was the mystery of the sweet toastie. They have consistently taken some of the the highest marks at tastings, despite being served last, when everyone should really be full. The highest average rating until 2015 was the Salmon toastie from two years ago, with a score of 8.5. Until the cheesecake toastie came along and smacked it off the top spot with an 8.63. Our new tastiest toastie. Higher scoring than the Juggernaut. It’s a shame nobody buys them really. Sweet toasties make up around 3% of our total toastie sales.
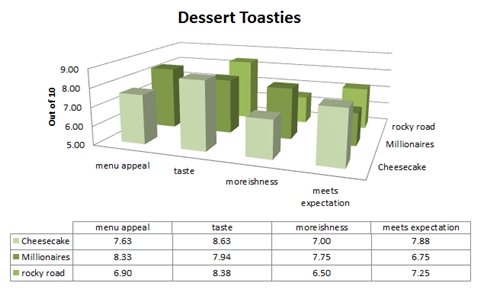
Here are the last 3 years of desserts, and this year the cheesecake seems to have finally nailed menu appeal and taste for the first time. Perhaps this is the beginning of a new era of sweet toasties? Or I can get my spreadsheets out next time someone says a sweet toastie sounds gross. Either way.
In Summary.
I think we’ve all learnt something today. I have learnt that I will spend the best part of 8 hours analysing data for no better reason than this. Also something about negativity selling. You have learnt that I can spend 8 hours analysing data and all you get is a single blog post. Also something about cheesecake toasties.
Thanks again for all your toastuary support. I think the ultimate goal of finding a speciality is a big step closer. People reading/commenting/sharing every day were a big part of carrying on. Special shout out to all our tasters for the toasting and to @psychmoochoo who read and commented on every single post(on Facebook).


100% with you on the WHY for the Marmite toastie. What is wrong with people.
The prawn and the scotch egg toasties were just awesome, knocked-it-out-of-the-park awesome. Great work 🙂
Not to be a stickler for statistical accuracy but you aren’t banking on the fact that these are all relative scores compared to the other toasties in the group. You guys on the other hand were tasting some real oddball toasties which would have pushed the scores of nicer toasties way up.
TLDR: It was very hard to decide between what tasted good, what was delicious and what was scrumptious!